Usage Examples
Coastlines
>>> import nzgeom.coastlines
>>> c =  nzgeom.coastlines.get_NZ_coastlines()
>>> c
                               name macronated  ...                     name_ascii                                           geometry
0                              None          N  ...                           None  MULTIPOLYGON (((175.76343 -36.43109, 175.76327...
1                              None          N  ...                           None  MULTIPOLYGON (((175.76337 -36.43096, 175.76312...
2                              None          N  ...                           None  MULTIPOLYGON (((168.14925 -47.11982, 168.14868...
3                              None          N  ...                           None  MULTIPOLYGON (((166.90386 -46.58083, 166.90376...
4                         Lion Rock          N  ...                      Lion Rock  MULTIPOLYGON (((175.75020 -36.77198, 175.74985...
...                             ...        ...  ...                            ...                                                ...
9134  Tāhuahua-Paopao-Karoro Island          Y  ...  Tahuahua-Paopao-Karoro Island  MULTIPOLYGON (((173.28982 -34.90622, 173.29034...
9135              Wakatehāua Island          Y  ...              Wakatehaua Island  MULTIPOLYGON (((172.89280 -34.68681, 172.89304...
9136               Ōhau/West Island          Y  ...               Ohau/West Island  MULTIPOLYGON (((172.03345 -34.18387, 172.03354...
9137     Manawatāwhi / Great Island          Y  ...     Manawatawhi / Great Island  MULTIPOLYGON (((172.14683 -34.14436, 172.14729...
9138  North Island or Te Ika-a-Māui          Y  ...  North Island or Te Ika-a-Maui  MULTIPOLYGON (((175.13516 -41.37745, 175.13507...
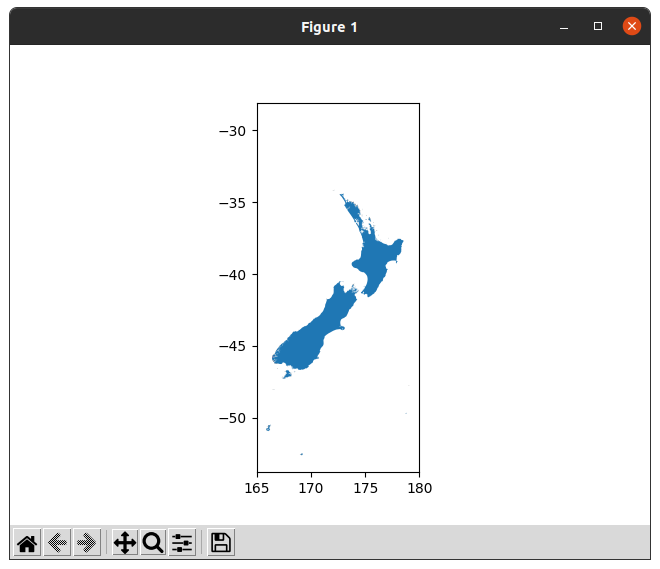
If matplotlib is available, it’s easy to plot the coastline geodataframe (or add the coastlines to an existing plot):
>>> import matplotlib.pyplot as plt
>>> ax = c.plot
>>> ax.set_xlim([165, 180])
>>> plt.show()
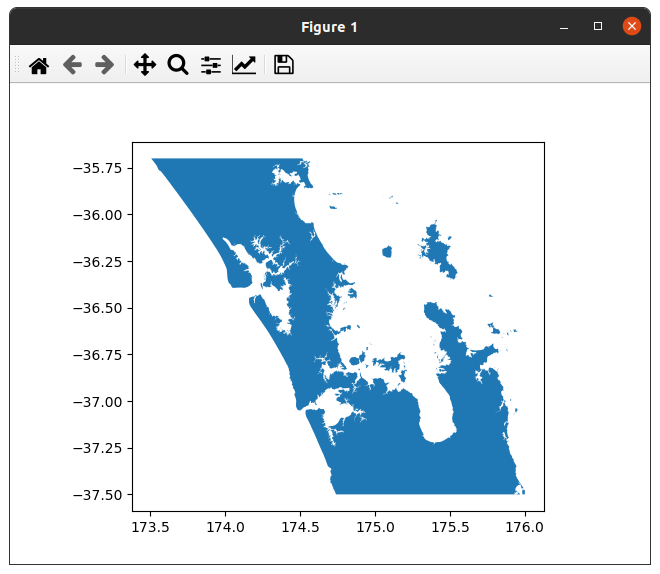
clipping to a bounding box
Restrict the coastlines polygons returned by providing a bounding box. The full coastlines dataset contains more than 9000 polygons, so this can speed things up if you are focussed on a particular area.
>>> import nzgeom.coastlines
>>> c =  nzgeom.coastlines.get_NZ_coastlines(bbox=(173.5, -37.5, 176.0, -35.7))
clipping to bounding box (173.5, -37.5, 176.0, -35.7)
>>> import matplotlib.pyplot as plt
>>> ax = c.plot()
>>> plt.show()
Council region boundaries
>>> import nzgeom.regions
>>> r = nzgeom.regions.NZRegions()
>>> r.list_regions()
        Northland Region
         Auckland Region
          Waikato Region
    Bay of Plenty Region
         Gisborne Region
      Hawke's Bay Region
         Taranaki Region
Manawatu-Wanganui Region
       Wellington Region
       West Coast Region
       Canterbury Region
            Otago Region
        Southland Region
           Tasman Region
           Nelson Region
      Marlborough Region
     Area Outside Region
>>> r.get_region_geodataframe("Auckland Region")
  REGC2018_V1_00 REGC2018_V1_00_NAME  LAND_AREA_SQ_KM    AREA_SQ_KM   Shape_Length                                           geometry
1             02     Auckland Region      4941.572557  16156.610062  659677.328124  MULTIPOLYGON (((1788533.265 6047342.800, 17891...
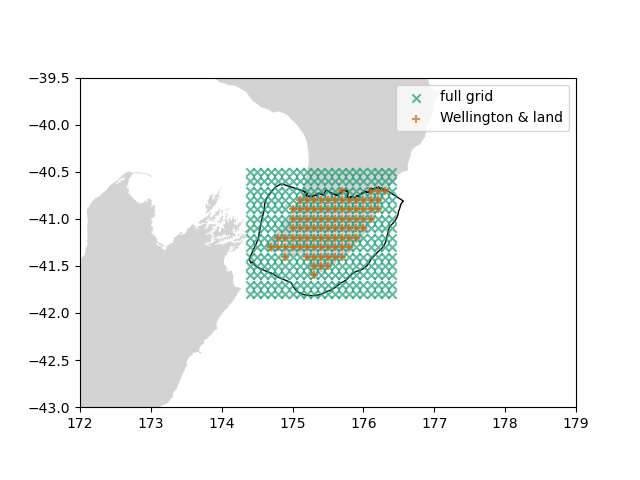
Mask a grid’s coordinates to land areas within the Wellington Region:
import numpy as np
import matplotlib.pyplot as plt
import geopandas as gpd
from shapely.geometry import Point
import nzgeom.coastlines
import nzgeom.regions

LATLON = "EPSG:4326"

coast = nzgeom.coastlines.get_NZ_coastlines().to_crs(LATLON)
nzreg = nzgeom.regions.NZRegions()
wellington_region = nzreg.get_region_geodataframe("Wellington Region").to_crs(LATLON)

# make a 0.1 by 0.1 degree grid, put it in a geopandas.GeoDataFrame
grid_lons, grid_lats = np.meshgrid(
np.arange(174.4, 176.5, 0.1), np.arange(-41.8, -40.4, 0.1)
)
dummy_grid = gpd.GeoDataFrame(
geometry=[
Point(lon, lat) for lon, lat in zip(grid_lons.flatten(), grid_lats.flatten())
],
crs=LATLON,
)
# mask out points outside Wellington Region
dummy_grid_wellington_landonly = gpd.clip(dummy_grid, wellington_region)
# mask out water points
dummy_grid_wellington_landonly = gpd.clip(dummy_grid_wellington_landonly, coast)

# draw the coastlines, Wellington Region, the full grid, and the masked grid.
fig, ax = plt.subplots()
coast.plot(ax=ax, color="lightgray", label="New Zealand")
wellington_region.plot(ax=ax, color="None", label="Wellington Region")
dummy_grid.plot(ax=ax, marker="x", color="#1b9e77", alpha=0.7, label="full grid")
dummy_grid_wellington_landonly.plot(
ax=ax, marker="+", color="#d95f02", alpha=0.7, label="Wellington & land"
)
ax.set_xlim([172, 179])
ax.set_ylim([-43.0, -39.5])
ax.legend()
plt.show()